 |
 |
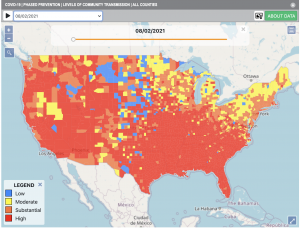
| August 2, 2021 |
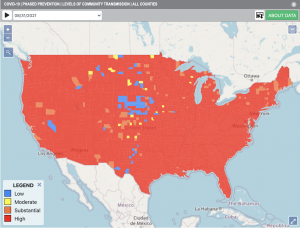
August 31, 2021 |
Today I want to share a remarkable website for those wanting to get an accurate view of COVID-19 metrics around the country – down to the county level! Anyone concerned about the status and future direction of the pandemic in the U.S. should explore this CDC site, which also offers actual projections of new cases and deaths for the next 4 weeks based on real-time data at the state level (you can even click on different parts of the graphs to see the accuracy of previous projections.)
Examining the graphs and projections for different areas of the country makes it easier to get a good sense of what’s going on and what challenges we may still be facing. The thing that surprised and shocked me the most was discovering the above before and after graphic (from screen grabs of the animation on the site), which shows that the last pockets of low and moderate community transmission levels in the entire nation have turned almost completely RED (highest transmission rate) in the last 30 days!
Two indicators are used by the CDC to define levels of community transmission:
- Total number of new cases per 100,000 persons within the last 7 days and
- Percentage of positive diagnostic test during the last 7 days.
Using these criteria, the RED (highest transmission) level is when the cumulative cases are >100 per 100,000 population or a cumulative test positivity result > 10% in the past 7 days.
We are currently at the highest COVID-19 transmission levels almost everywhere in the country!
So even though when I look out the window or go for a walk, things might appear (and we really wish they were) sort of back to normal – things are definitely not back to normal yet!
Orange County, CA latest trends – now for some good news!
I also wanted to share some good regional news. As you know, I’ve been closely tracking OC COVID-19 metrics in preparation for starting to see patients again. I have found that the testing positivity percentage and the new case rates in OC have started to come down over the last couple of weeks! My metrics and graphs match up almost exactly with the graphs on the CDC site. However, before we start to celebrate, we still need to be aware that the positivity is still 10x greater and new case rate is over 20x greater than it was at the beginning of the summer.
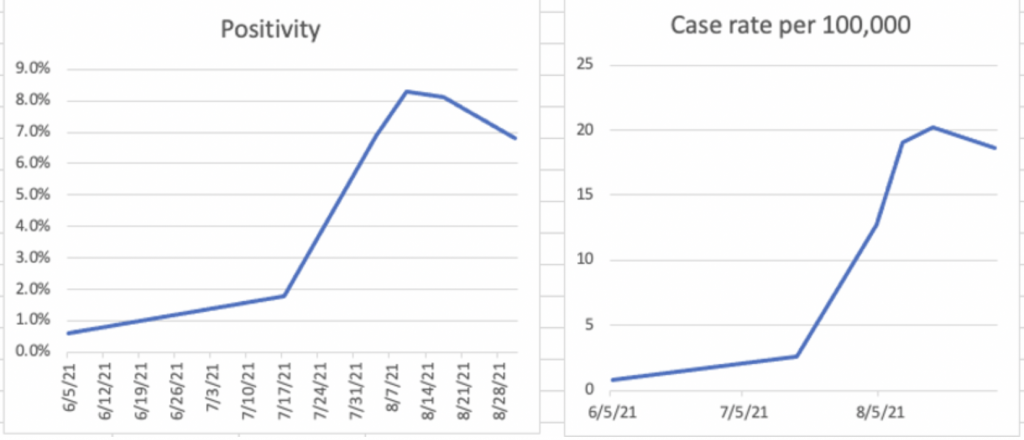 Let’s pray that the OC metrics continue to come down – and hope that it comes down rapidly! We all could help by getting vaccinated and using masks and social distancing where appropriate. It feels like I shouldn’t need to say this, with masks and vaccinations having unequivocally proven to be so effective at preventing misery and death, but I just found out that I happen to live in one of the least fully vaccinated zip codes in Orange County – Newport Beach! Let’s pray that the OC metrics continue to come down – and hope that it comes down rapidly! We all could help by getting vaccinated and using masks and social distancing where appropriate. It feels like I shouldn’t need to say this, with masks and vaccinations having unequivocally proven to be so effective at preventing misery and death, but I just found out that I happen to live in one of the least fully vaccinated zip codes in Orange County – Newport Beach!
|
Comments are closed.